Welcome to our blog post on the Project Phase and Level of Activity Comparison Graph, a new interactive tool developed by our team to help businesses plan their projects with confidence. In this post, we'll take a closer look at how the tool works and how it can be used to make informed decisions about resources and support. We'll also share a case study that demonstrates the power of data and analytics in project planning.
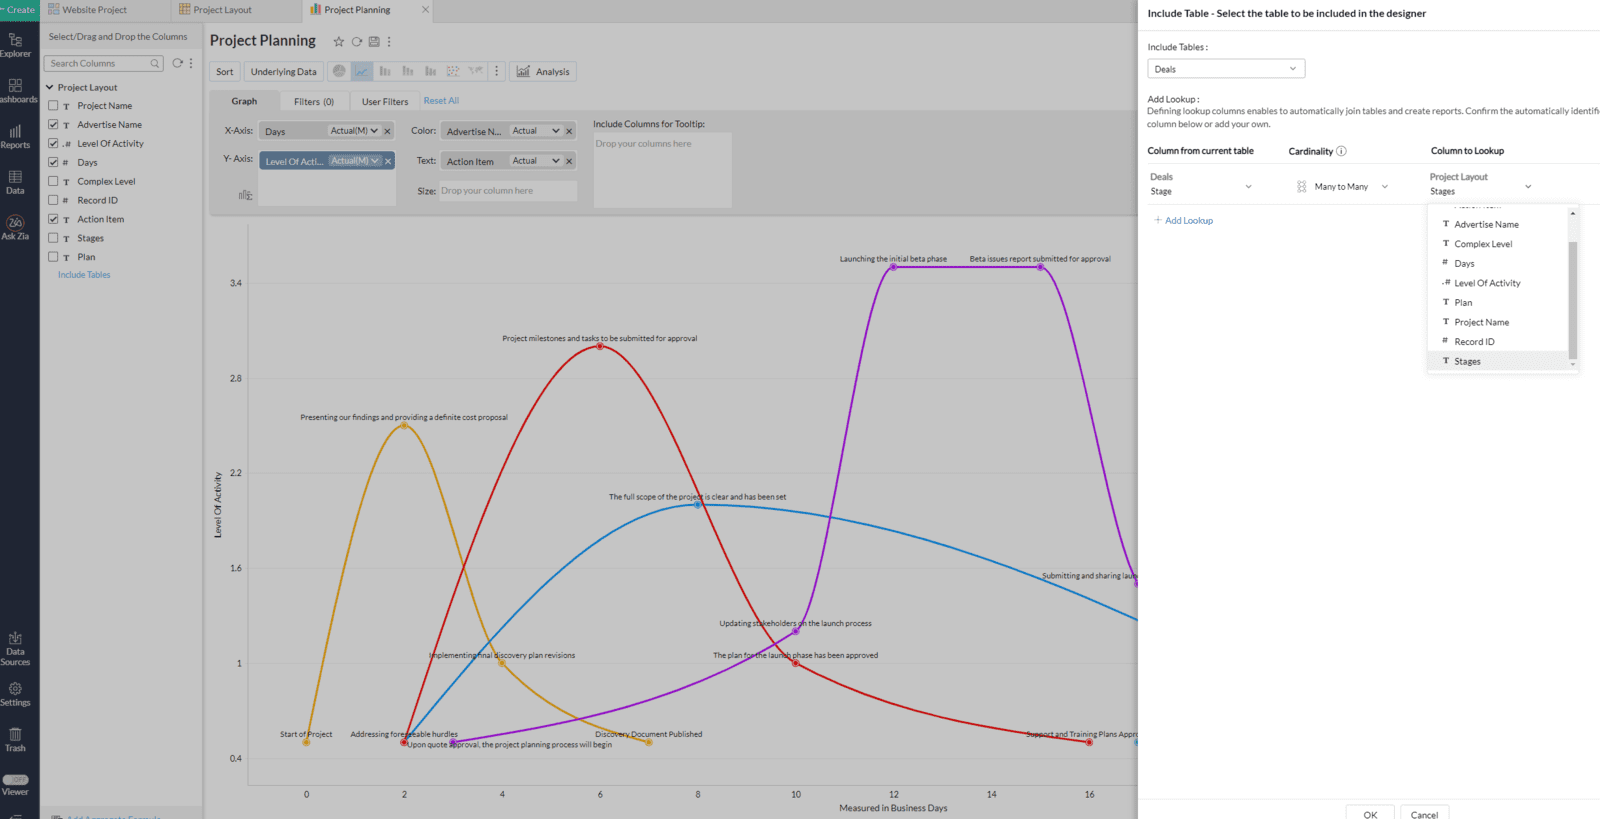
So, what exactly is the Project Phase and Level of Activity Comparison Graph? Simply put, it's a visualization tool that allows you to see the differences in time and effort required for different project phases, depending on the complexity level and plan you choose. By selecting different options from the drop-down menus, you can see how the duration and level of activity change for each phase: Discovery, Development, Launch, and Support.
But why is this tool so useful? First and foremost, it helps businesses plan their projects with greater accuracy and efficiency. By understanding the time and effort required for each phase, you can allocate resources appropriately and make informed decisions about the support you'll need. This can save time and money in the long run, and help ensure that your project is a success.
But the tool is also valuable because it illustrates the power of data and analytics in project planning. By visualizing the data in an easy-to-understand format, you can quickly see the relationships between different variables and make more informed decisions. It's a great example of how data and analytics can be used to create innovative solutions and make better business decisions.
To give you a better idea of how the Project Phase and Level of Activity Comparison Graph can be used in real-world situations, we've included a case study below.
Case Study: A Small Business Website Redesign
Our client, a small business owner, was looking to redesign their website and make it more user-friendly and modern. They wanted to know how much time and effort would be required, and how they could allocate their resources to make the most of their budget.
After selecting the Basic Boost complexity level and the ProjectPro plan on the graph, they were able to see that the project would require about 20 days of discovery, 15 days of development, 5 days of launch, and 10 days of support. This helped them understand the time and effort required and plan their budget accordingly.
As you can see, the Project Phase and Level of Activity Comparison Graph is a powerful tool for businesses looking to plan their projects with confidence. By understanding the time and effort required for each phase and selecting the right complexity level and plan, you can make informed decisions about resources and support and increase your chances of success. We hope this tool will be a valuable resource for you and your business.
In conclusion, the Project Phase and Level of Activity Comparison Graph is a valuable tool for businesses looking to plan their projects with confidence. It helps you understand the time and effort required for each phase and make informed decisions about resources and support. And with its visually appealing and easy-to-use design, it's a great example of how data and analytics can be used to create innovative solutions and make better business decisions.
So, if you're looking to plan your next project with confidence and increase your chances of success, we encourage you to give our tool a try. And if you have any questions or would like to know more about how we can use data and analytics to support your business, don't hesitate to contact us. Our team is here to help and we look forward to discussing your needs and how we can work together to achieve your goals. Don't wait – take the first step towards success and try our Project Phase and Level of Activity Comparison Graph today!